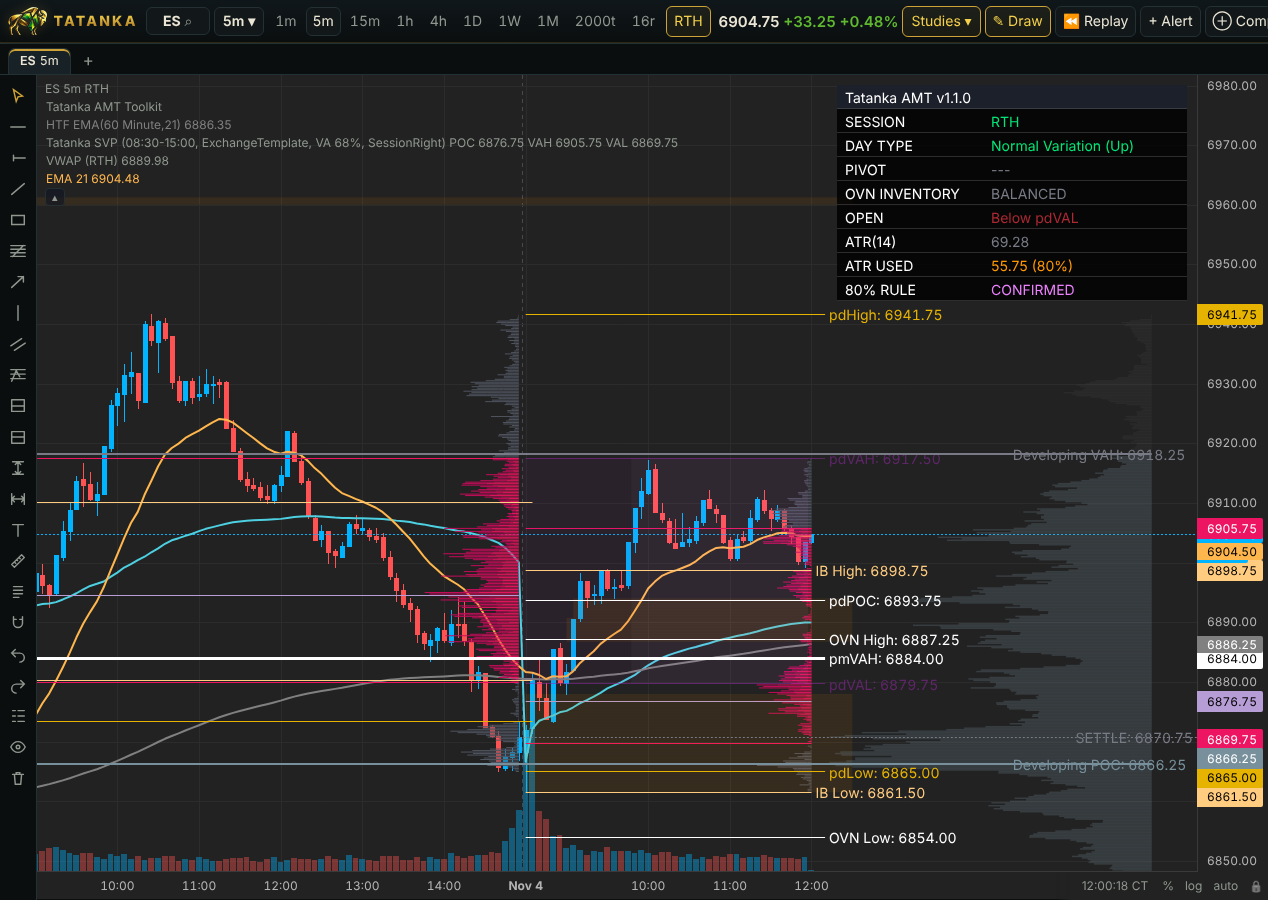
The Tatanka Studies
The AMT Toolkit, TPO Profile, Session, Periodic and Auto Anchored volume
profiles, Gap Analysis, If/Then, HTF EMA, Daily SMA and Level Lines, ported from the NinjaTrader
versions and checked against them, on each market's own hours. Add several HTF EMAs or
volume profiles to one chart.
Your Daily Levels
Paste a levels line, or point it at a levels file or link, and the levels draw
on every chart with alerts. Subscribers use the daily ML levels ($20/mo); anyone can paste their
own.
Bar Replay & Deep History
Scroll back through a year or more of history, or replay any session bar by
bar, with the studies and levels as they stood at that moment.
Every Bar Type
Time, tick, volume, range and Renko bars, footprint, big-trade bubbles, and
your NinjaTrader fills on the chart.
Formula & Ratio Charts
Type VIXM/VIXY, ES1!/NQ1! or any formula
over up to 10 symbols and chart it, with indicators and drawings on it.
Alerts With No Chart Open
Price, level, drawing, indicator and news alerts run on your PC and reach you
as app notifications, in Discord or through ntfy.
Watchlists & Free Data
Watchlists for futures, stocks and crypto, plus FRED, EIA and COT data and an
economic calendar.
Desktop & Phone
Use it in your browser, or install it as an app on Windows, iPhone or Android.
It never places orders.